
How to Read a GC-MS Report for Essential Oils: A Buyer’s Guide
Last reviewed: September 2026 · By Piyush Gupta, Founder & CEO, Kanha Nature Oils · 27 years of industry experience · FAFAI Regional Secretary, North Zone · EOAI Treasurer
How to read a GC-MS (Gas Chromatography–Mass Spectrometry) report for an essential oil, in short: look at the peak table, identify the compounds expected to be characteristic of that particular oil, compare their reported levels with appropriate published specifications or reference ranges, and confirm that the report’s botanical name, batch number and date match the material you are actually receiving.
A GC-MS report helps show which volatile compounds are present and their approximate relative abundance. It does not, by itself, prove geographical origin, extraction method, organic certification, overall purity, or safety.
This guide explains how to read a GC-MS report step by step so you can evaluate an essential-oil supplier’s documentation more intelligently.
What Does a GC-MS Report Actually Tell You?
GC-MS combines gas chromatography, which separates volatile compounds, with mass spectrometry, which helps identify those separated compounds from their mass-spectral characteristics.
The result is a report listing compounds detected in the sample, their retention times and their estimated relative abundance. For a buyer, this matters because an essential oil’s chemical profile should be consistent with the botanical species, plant part, origin and production characteristics claimed for the material.
For example, genuine lavender oil is expected to contain characteristic levels of compounds such as linalool and linalyl acetate. If a report for a product sold as lavender shows an unusual profile, that is a reasonable reason to ask the supplier for an explanation.
MS vs. FID: Identification and Quantification
A common misconception is that MS identifies while FID always quantifies.
In practice, the mass spectrometer is primarily used for compound identification, while quantitative work may be performed using the MS detector itself or, in many laboratory workflows, with a separate flame ionization detector (FID).
FID is widely used for quantitative GC analysis because its response to many organic compounds is useful for relative quantification. However, the exact detector configuration and calculation method depend on the laboratory and analytical method.
So when reading a report, do not assume that the words “GC-MS” automatically tell you which detector was used for quantification. If the quantitative method matters to your purchase, ask the laboratory or supplier for the analytical method.
A GC-MS report is a chemistry document, not a marketing document. The useful question is not simply whether a report exists, but whether the reported chemistry is appropriate for the specific botanical material being supplied.
What Are the Main Parts of a GC-MS Report?
Most essential-oil GC reports contain several core elements.
What Is the Chromatogram?
The chromatogram is the graph showing peaks across a retention-time axis.
Each peak represents a detected component or, in some cases, more than one component if compounds co-elute under the analytical conditions.
For quantitative interpretation, peak area is generally more useful than peak height. Peak area represents the integrated detector response over the time that the compound elutes. Peak height alone can give a misleading impression because two peaks with different widths can have very different areas.
However, peak area should not be interpreted as an exact weight percentage unless the analytical method and calibration support that conclusion. In many essential-oil reports, area percentage is used as an estimate of relative composition.
A Large Peak Is Not Automatically a Red Flag
Some genuine essential oils naturally have one strongly dominant constituent.
For example:
- Wintergreen oil is typically dominated by methyl salicylate.
- Cassia and cinnamon bark oils are commonly rich in cinnamaldehyde.
- Eucalyptus globulus oil is commonly rich in 1,8-cineole.
- Carrot seed oil can have a high proportion of carotol.
Therefore, a chromatogram with one very large peak is not, by itself, evidence of adulteration.
The correct question is:
Does the overall profile match the expected chemistry of this particular botanical material?
What Is the Peak Table?
Below the chromatogram is normally a table listing the detected peaks.
Common columns include:
- Peak number
- Retention time
- Compound name
- CAS number, where available
- Area %
- Sometimes Height %
- Sometimes Retention Index (RI)
- Sometimes identification quality or library-match information
The peak table is usually more useful to a buyer than simply looking at the chromatogram.
Co-elution: One Peak Can Contain More Than One Compound
Closely related compounds can sometimes co-elute, meaning that they leave the GC column at nearly the same time and appear as a single chromatographic peak.
This can happen even with commonly used analytical columns.
If separating individual isomers is important for your application, ask the laboratory whether a different column, confirmatory method, or more advanced technique was used.
What Is Retention Time?
Retention time (RT) is the time taken for a compound to travel through the GC system before being detected.
RT can be useful when comparing results generated using the same or closely matched analytical conditions.
However, raw retention time should not be treated as a universal identifier across laboratories.
It can change depending on factors such as:
- Column chemistry
- Column dimensions
- Carrier-gas flow
- Oven-temperature programme
- Instrument configuration
- Other analytical conditions
Therefore, the same compound can legitimately have different retention times on two laboratories’ reports.
For cross-laboratory comparison, buyers should pay more attention to retention indices (RI), together with mass-spectral identification and the expected chemical profile, rather than comparing raw RT values alone.
What Are the Compound Name and CAS Number?
The compound name identifies the substance detected in the analysis.
Examples include:
- Linalool
- Linalyl acetate
- Eugenol
- Limonene
- Citral
- 1,8-Cineole
A CAS number is a standardized registry identifier that can help cross-check chemical identity.
CAS numbers are useful because compound names can sometimes vary slightly between laboratories, software libraries or reporting conventions.
What Is Peak Area Percentage?
Peak area percentage represents the relative detector response contributed by a particular peak compared with the total integrated peak area used in the calculation.
It is widely used to estimate the relative composition of essential oils, but it should not automatically be treated as an exact weight-by-weight composition.
Different compounds can produce different detector responses. Therefore, area normalization is an approximation unless the method uses appropriate calibration or response factors.
Why Don’t the Percentages Always Add Up to 100%?
A GC report does not necessarily list every trace component in the oil.
Depending on the laboratory’s method, integration rules and identification/reporting threshold, very small peaks may be excluded, unidentified, or reported separately.
As a result, the identified and reported percentages may add up to somewhat less than 100%.
A total such as 97% is therefore not automatically evidence that 3% of the oil is missing or adulterated.
The important question is how the laboratory generated and reported the result.
What a Real Peak Table Looks Like
Below is a redacted numerical extract from an actual GC-MS report, with product and company identifiers removed while retaining the analytical values.
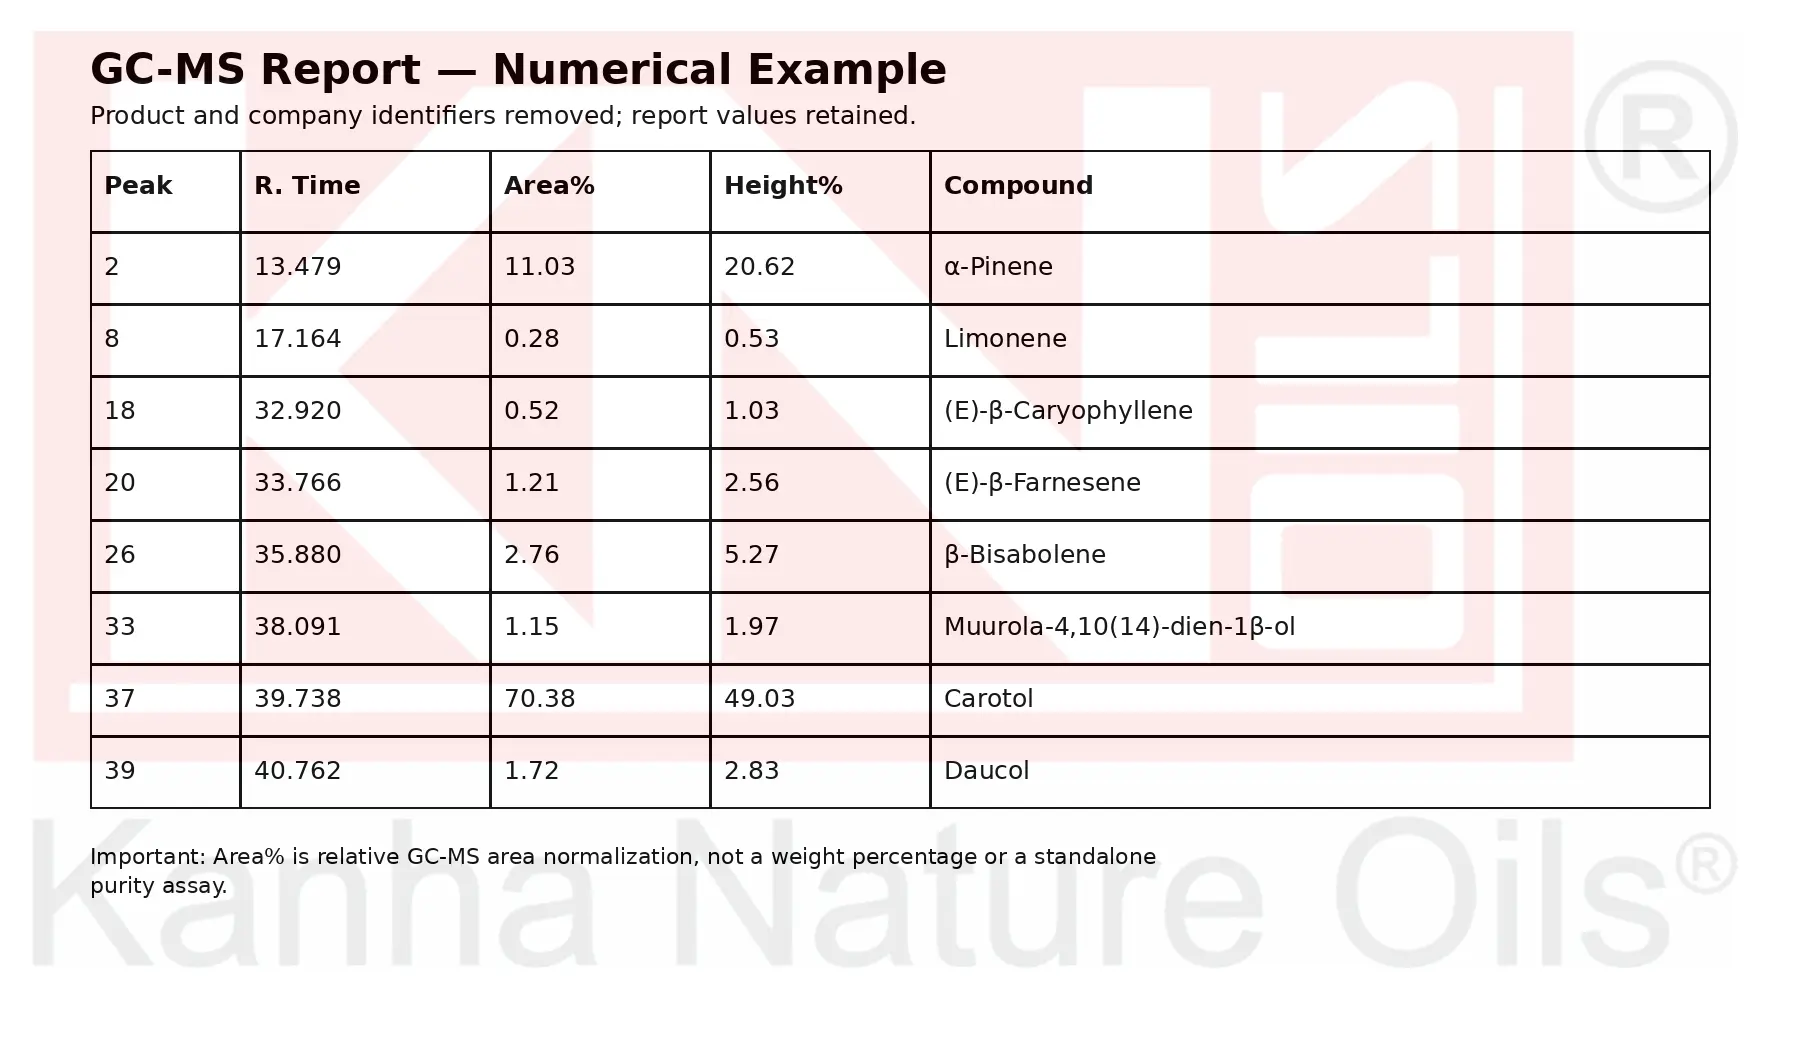
GC-MS report numerical example showing peak number, retention time, Area%, Height%, and compoundThe example demonstrates why buyers should read Area % and Height % separately.
For example, in the numerical extract:
- One peak represented 70.38% by area but 49.03% by height.
- Another represented 11.03% by area but 20.62% by height.
These are not interchangeable figures.
The example also demonstrates an important buyer lesson: a single compound accounting for a large proportion of an essential oil is not automatically suspicious. The interpretation depends on the botanical species and its expected chemical profile.
How Do You Read a GC-MS Report? Step by Step
1. Confirm the Sample Identity
Check:
- Botanical name
- Plant part
- Batch or lot number
- Report date
- Sample date, where provided
- Supplier/product reference
The report should correspond to the actual material being purchased rather than being a generic report from an unrelated batch.
2. Identify the Characteristic Compounds
Many essential oils have characteristic compounds or groups of compounds that are useful when assessing their chemical profile.
Examples include:
- Citral in lemongrass oil
- Eugenol in clove bud oil
- Linalool and linalyl acetate in many lavender oils
- 1,8-Cineole in many Eucalyptus globulus oils
These compounds should be interpreted in the context of the exact botanical species, plant part and applicable specification.
3. Compare the Reported Percentages
Compare important compounds with an appropriate reference source, such as:
- Applicable ISO standards
- Pharmacopoeial monographs
- Recognized industry monographs
- Validated laboratory or customer specifications
Do not treat one percentage outside a reference range as automatic proof of adulteration. Natural materials can vary with cultivar, geography, climate, harvest conditions, processing and storage.
4. Look for Unexpected Compounds or Patterns
Look for:
- Unexpected major constituents
- Unusual concentration patterns
- Compounds inconsistent with the declared botanical
- Evidence that may suggest dilution, reconstitution or addition of isolated constituents
A GC-MS result should be interpreted as a profile, not by looking for one supposedly “bad” compound in isolation.
5. Consider the Number of Reported Compounds
A naturally complex essential oil would normally be expected to show more than only a couple of constituents.
However, the number of reported compounds depends on the oil, analytical method, reporting threshold and laboratory practice.
Therefore, a short compound list does not automatically mean the test is low quality.
Ask for the chromatogram, method details and identification criteria when the result appears unusually incomplete.
6. Check the Laboratory and Method
Where available, check:
- Laboratory name
- Instrument/method information
- Column information
- Testing date
- Sample identification
- Detector configuration
- Relevant analytical standard or method
This improves traceability if you later need to discuss the result with the laboratory.
7. Cross-Reference the COA
Read the GC-MS together with the Certificate of Analysis.
A COA may provide complementary physical and quality parameters such as:
- Specific gravity
- Refractive index
- Optical rotation
- Appearance
- Odour
- Flash point
- Non-volatile residue
These parameters can provide additional evidence when assessing whether the batch is consistent with the expected material.
They should be treated as complementary evidence, not as an infallible test for every type of adulteration.
Where to Find Published Marker-Compound Ranges
When comparing an essential-oil profile, buyers should know where the reference values come from.
Useful sources include:
ISO Standards
ISO publishes standards for individual essential oils through ISO/TC 54.
For example:
- ISO 3515:2002 covers oil of lavender (Lavandula angustifolia Mill.).
- ISO 3142:1997 covers oil of clove buds.
Always check the ISO website or the applicable purchasing specification for the current status of a standard before relying on numerical requirements.
Pharmacopoeial Monographs
Depending on the intended application, buyers may also consult relevant pharmacopoeial monographs, such as the European Pharmacopoeia or British Pharmacopoeia.
The applicable monograph depends on the specific oil and intended use.
Industry Monographs
Recognized industry references, including Essential Oil Association (EOA) monographs where applicable, can provide additional comparative information.
Example Reference Ranges
The following are examples of commonly cited constituent ranges from the standards/reference material used for comparison. They should be treated as reference values, not universal acceptance criteria for every batch.
| Oil | Characteristic constituent | Example published range | Reference |
|---|---|---|---|
| Lavender (Lavandula angustifolia) | Linalool | 25–38% | ISO 3515:2002 |
| Lavender (Lavandula angustifolia) | Linalyl acetate | 25–45% | ISO 3515:2002 |
| Clove bud | Eugenol | 75–85% | ISO 3142:1997 |
For procurement decisions, use the specification applicable to the exact botanical material you are buying. Do not assume that a range for one lavender type automatically applies to lavandin, spike lavender or another botanical material.
What “Normal” Looks Like vs. What Should Raise Questions
| Signal | Generally Consistent | Worth Investigating |
|---|---|---|
| Marker compound % | Within the applicable published/specification range | Significantly outside the expected range without explanation |
| Number of compounds | Consistent with the expected complexity of the oil | Unusually short or incomplete profile for a naturally complex oil |
| Batch/date | Matches the actual shipment | Generic, undated or unrelated batch information |
| Lab/method | Method and laboratory information available | No meaningful method or laboratory information |
| Repeat batches | Reasonably consistent profile | Large unexplained changes between batches |
| Dominant peak | Expected for that botanical | Unexpected dominant constituent |
| Unexpected compounds | Minor variations can occur | Pattern inconsistent with the declared botanical |
Natural essential oils can vary from batch to batch because they are agricultural products.
Growing conditions, cultivar, geographical region, harvest timing, plant part, extraction conditions and storage can all influence composition.
The objective is therefore not to find two reports that are mathematically identical. The objective is to determine whether the profile remains consistent with the expected identity and specification of the material.
GC-MS Report vs. COA vs. SDS — What’s the Difference?
These documents answer different questions.
GC-MS Report
A GC-MS report primarily addresses:
“What volatile compounds were detected, and what is their approximate relative abundance?”
It is an important analytical tool for characterizing essential-oil chemistry, but it is not by itself a complete purity, contamination or safety assessment.
COA — Certificate of Analysis
A COA addresses:
“Does this particular batch meet the stated quality specifications?”
Depending on the product and supplier, it may include physical parameters such as:
- Appearance
- Odour
- Specific gravity
- Refractive index
- Optical rotation
- Flash point
- Non-volatile residue
- GC-MS or chromatographic results
The exact parameters depend on the product specification.
SDS — Safety Data Sheet
An SDS addresses:
“How should this material be classified, handled, stored, transported and managed safely?”
An SDS is a safety document, not a batch-specific certificate of purity.
The term SDS is the modern terminology used in GHS-aligned regulatory systems. “MSDS” is still widely used informally, but buyers should generally request the current SDS.
A complete documentation package can therefore include all three:
GC-MS → chemical profile
COA → batch quality/specification
SDS → safety and handling
None of these documents is a complete substitute for the others.
Real COA Numerical Example
Here is a redacted numerical example showing how physical-property results can be compared with specifications:
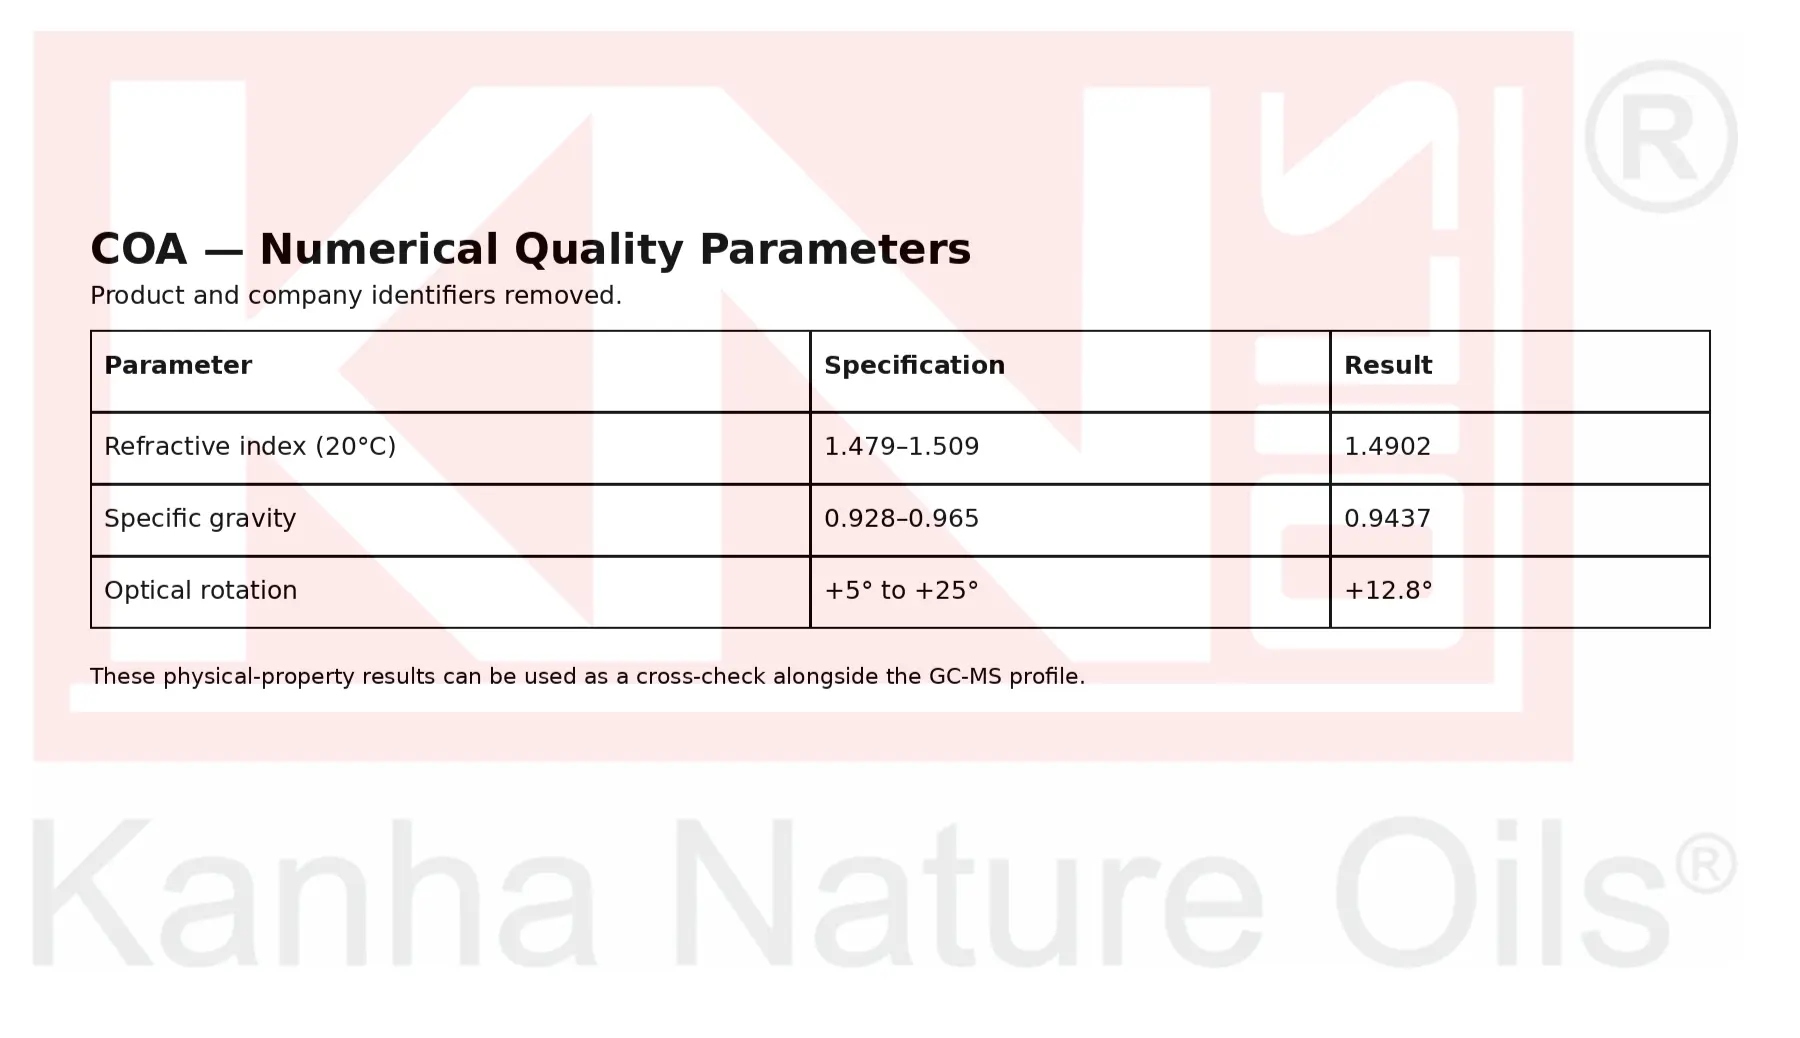
COA numerical example showing refractive index, specific gravity, and optical rotationThe example shows refractive index, specific gravity and optical rotation presented against a specification and result. These physical-property results can be used as a cross-check alongside the GC-MS profile.
Real SDS Numerical Example
An SDS may contain composition-related information and physical/handling data, but its purpose remains safety communication rather than batch-quality certification.
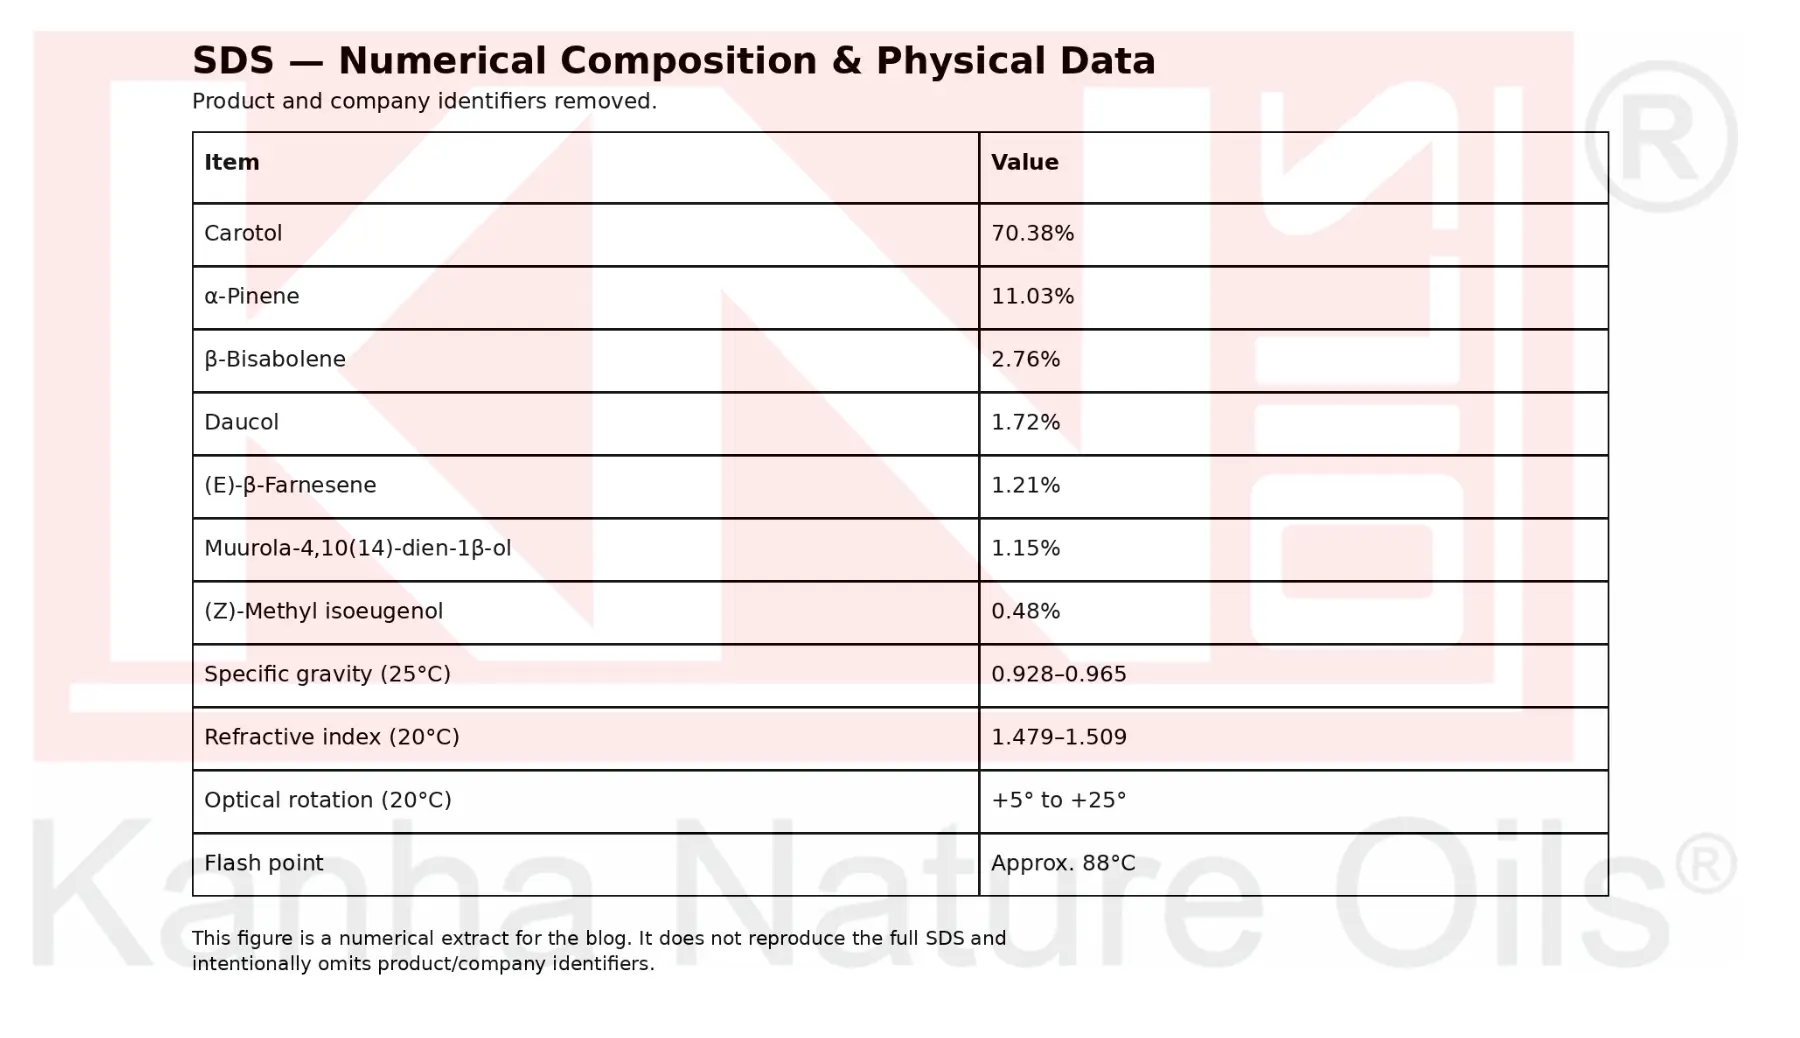
SDS numerical example showing composition percentages and physical dataThis redacted numerical example illustrates the type of composition and physical data that may appear in supplier documentation. Always distinguish reference information in an SDS from batch-specific results in a COA.
What Common GC-MS Terms Should Buyers Know?
Chromatography: The separation technique used to separate components of a mixture.
Mass Spectrometry (MS): An analytical technique used to help identify compounds based on their mass-to-charge characteristics and fragmentation patterns.
FID (Flame Ionization Detector): A detector commonly used in GC analysis for quantitative measurement of many organic compounds. Some laboratories use FID alongside MS.
Marker Compound: A compound or group of compounds that is characteristic or useful for assessing the identity and consistency of a particular essential oil.
Retention Time (RT): The time at which a compound elutes from the GC column under specified analytical conditions.
Retention Index (RI): A standardized retention parameter that can make compound identification more comparable across analytical conditions than raw retention time alone.
Adulteration: In a commercial context, the undisclosed addition, substitution or modification of material in a way that misrepresents the product or its declared identity/specification.
Transparent products such as standardized, nature-identical or isolated-compound products are not necessarily adulterated simply because they contain intentionally added constituents; the key issue is whether the product is accurately described and sold according to its specification.
Chemotype (CT): A naturally occurring chemical variation within a botanical species that produces a different characteristic chemical profile.
What Can’t GC-MS Tell You?
GC-MS is a widely used analytical technique for characterizing the volatile chemistry of essential oils, but it has important limitations.
1. It May Not Detect Non-Volatile Dilution
Standard essential-oil GC conditions are designed to analyze volatile components.
A non-volatile material such as some vegetable oils or mineral-oil-type diluents may not appear as a normal peak in the GC-MS chromatogram.
This means a GC-MS profile that looks normal does not automatically rule out every type of non-volatile dilution.
That is one reason physical parameters and other appropriate analytical tests should be considered alongside GC-MS.
2. It Is Not a General Contaminant Screen
A standard essential-oil GC-MS composition test does not automatically test for:
- Heavy metals
- Pesticide residues
- Microbial contamination
- All phthalates
- Every possible solvent residue
- Every regulated contaminant
Those substances may require different analytical methods, depending on the material and intended market.
For example, pesticide analysis may use LC-MS/MS or GC-MS/MS, heavy metals may be tested using techniques such as ICP-MS, and microbiological quality requires dedicated microbiological methods.
3. It Does Not Independently Prove Organic Status
GC-MS cannot, by itself, establish that an essential oil is organically certified.
Organic status should be supported by the applicable organic certification and traceability documentation.
4. It Does Not Independently Prove Geographical Origin
Chemical profiling can sometimes provide useful clues about origin, but GC-MS alone should not be treated as definitive proof of geographical origin.
5. It Does Not Independently Prove Extraction Method
A GC-MS profile alone generally cannot establish every detail of how an oil was produced.
The claimed extraction method should be supported by supplier documentation and traceability.
6. Naturally Derived Adulteration Can Be More Difficult to Detect
Adulteration using naturally occurring constituents or materials that resemble compounds already present in the oil can be more difficult to identify using routine GC-MS alone.
Where a higher level of authentication is required, specialized approaches may include:
- Chiral GC
- Isotope-ratio mass spectrometry (IRMS)
- SNIF-NMR
- Radiocarbon (¹⁴C) analysis
The appropriate method depends on the authentication question being investigated.
What Other Documentation Do Regulated-Market Buyers Request?
For fragrance, cosmetic and other regulated applications, GC-MS, COA and SDS may not be the complete documentation package.
Depending on the market and intended use, buyers may also need regulatory or compliance documentation.
IFRA Standards and Conformity Information
The International Fragrance Association (IFRA) publishes Standards that establish restrictions or conditions for certain fragrance materials and constituents.
An important distinction is that IFRA does not itself issue an “IFRA certificate” for individual raw materials.
For fragrance mixtures, a Certificate of Conformity can be prepared by the relevant fragrance mixture manufacturer/supplier to declare compliance with applicable IFRA Standards for a specified intended use.
For essential oils and other natural complex substances, suppliers may instead provide information about conformity with applicable IFRA requirements and the presence of restricted constituents.
GC-MS data can be one important input when assessing the constituents of an essential oil, but IFRA conformity is not simply a GC-MS result.
The applicable IFRA requirement depends on the material, its constituents, the intended finished-product use/category and the relevant current IFRA Standard.
An IFRA conformity document also does not replace a safety assessment or compliance with applicable local regulations.
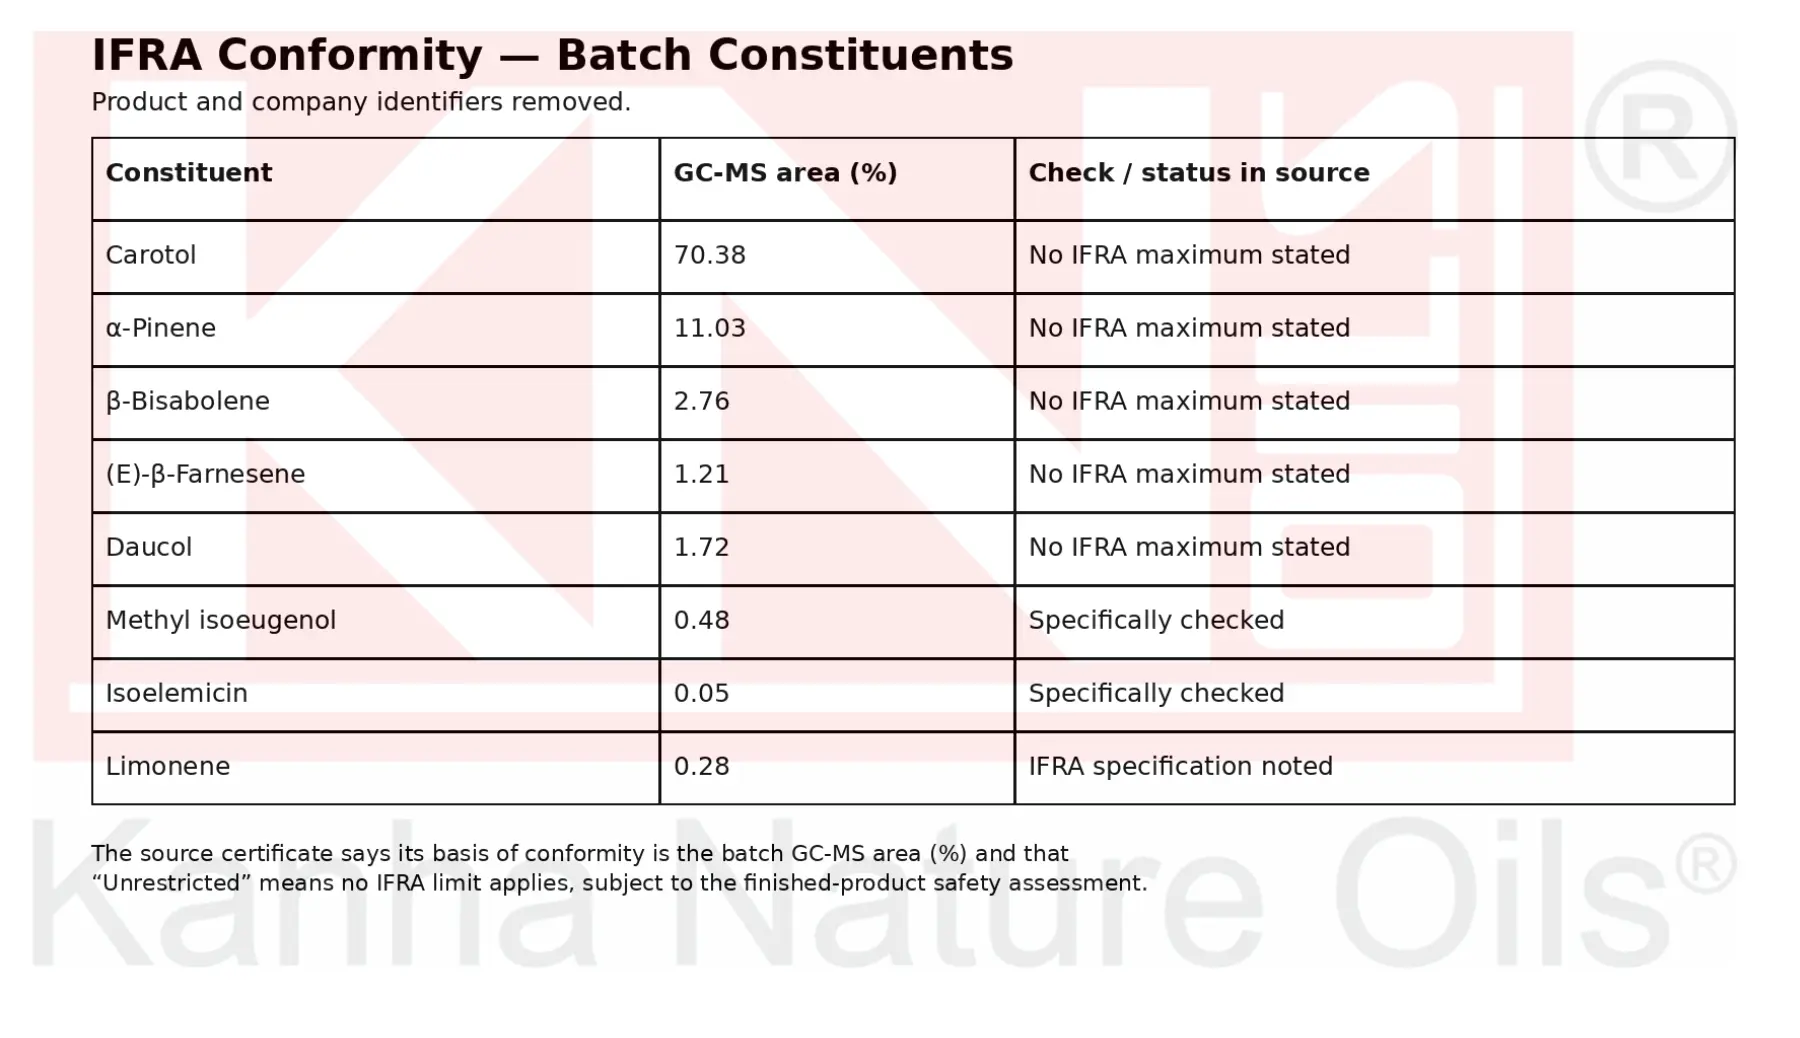
IFRA conformity numerical example showing batch constituents, GC-MS area, and check/statusThe example above shows how constituent-level information may be presented alongside GC-MS area percentages and a conformity/status field. The exact interpretation depends on the applicable IFRA Standard, intended use/category and finished-product context.
EU Fragrance-Allergen Information
For cosmetic products placed on the EU market, certain fragrance allergens must be individually identified on the ingredient label when present above the applicable regulatory thresholds.
The current EU framework includes additional fragrance allergens introduced through Commission Regulation (EU) 2023/1545, with transition arrangements extending into 2028 for certain products already placed on the market.
Importantly, the legal labelling thresholds apply to the finished cosmetic product, not simply to the concentration of an allergen in the raw essential oil.
Therefore, an essential-oil supplier may provide an allergen declaration based on analytical composition, but the cosmetic manufacturer still needs to determine the final finished-product labelling requirement based on the applicable regulation and formulation concentration.
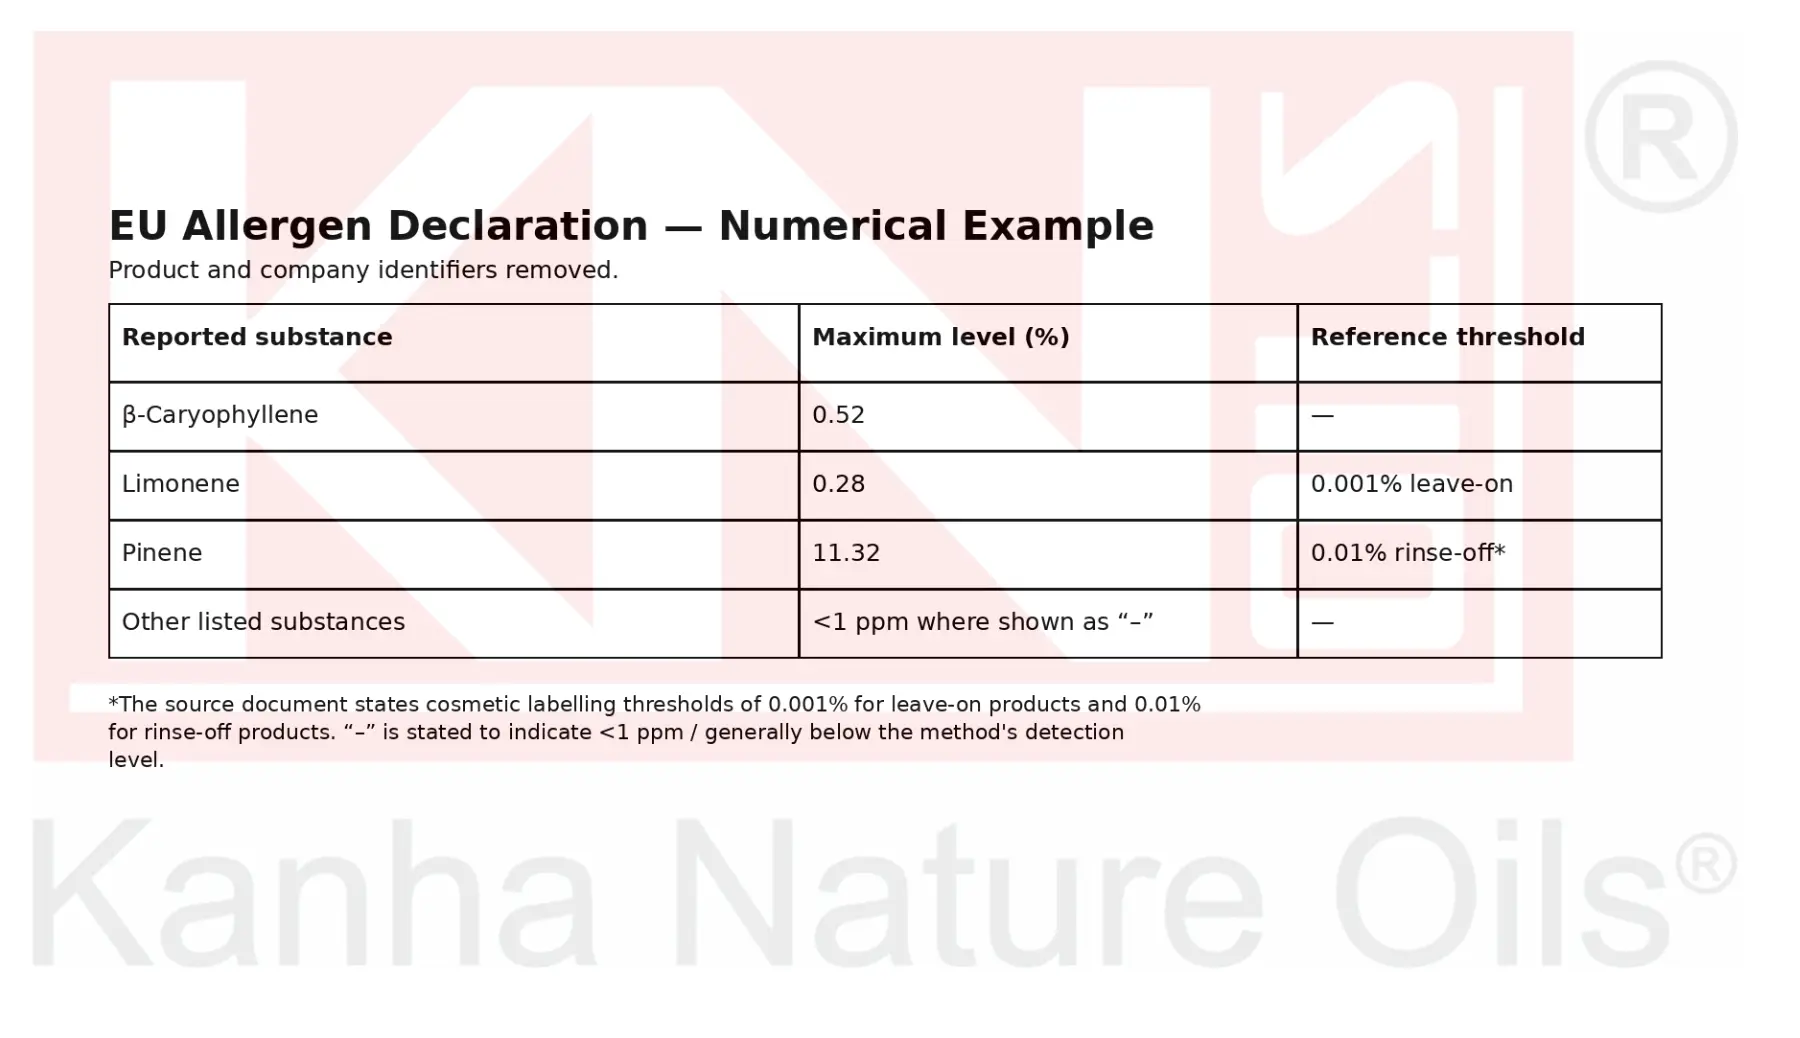
EU allergen declaration numerical example showing reported substances and reference thresholdsThis example illustrates how reported substance levels and reference thresholds may be displayed in supplier documentation. The final cosmetic-product labelling decision should be made using the applicable finished-product formulation and current EU requirements.
For buyers supplying the EU market, it is useful to ask suppliers for current allergen information alongside the GC-MS, COA and SDS where relevant.
FAQ
What is a GC-MS report used for in essential oils?
A GC-MS report is used to characterize the volatile chemical composition of an essential oil by separating and identifying its components and estimating their relative abundance.
It helps buyers assess whether the reported profile is consistent with the declared botanical material and applicable specifications.
Is a GC-MS report the same as a Certificate of Analysis?
No.
A GC-MS report focuses primarily on volatile chemical composition.
A COA is a broader batch-quality document and may include physical parameters, specifications and analytical results.
Can a GC-MS report prove that an essential oil is 100% pure?
No single document can prove every aspect of purity or authenticity.
GC-MS provides valuable evidence about volatile chemical composition, but it does not automatically detect every type of dilution or contamination and does not independently establish organic certification, geographical origin or extraction method.
For higher-risk applications, GC-MS should be interpreted together with the COA, SDS, traceability documents and any additional tests appropriate to the material and intended use.
What should I do if a GC-MS report looks unusual?
Start by checking:
- The botanical name
- Plant part
- Batch number
- Testing date
- Laboratory and method
- Major constituent percentages
- Unexpected compounds
- Previous batch results
- Applicable specifications or standards
Then ask the supplier to explain any significant deviation and provide supporting documentation where necessary.
Do essential-oil GC-MS profiles vary between batches?
Yes.
Essential oils are natural agricultural products, so their composition can vary with cultivar, growing conditions, geographical region, harvest timing, plant part, extraction conditions and storage.
The important question is whether the variation remains consistent with the expected profile and applicable specification for that particular oil.
Is one large GC-MS peak a sign of adulteration?
Not necessarily.
Some genuine essential oils naturally contain one highly dominant constituent.
A dominant peak should therefore be interpreted against the expected chemistry of the specific botanical rather than treated as evidence of adulteration by itself.
Sourcing an Essential Oil and Want to See a Sample Report First?
Request the documentation for the specific oil and batch you are evaluating, rather than relying only on a generic sample.
Depending on your application, useful documents may include:
- GC-MS report
- COA
- SDS
- Allergen declaration
- Applicable regulatory/compliance documentation
- Traceability information
Request a sample GC-MS report, COA and SDS for the specific essential oil you are evaluating, along with pricing for your required quantity.
About Kanha Nature Oils
Kanha Nature Oils manufactures and exports essential oils, attars, oleoresins, hydrosols, floral absolutes, spice oils and carrier oils from Bahadurgarh, India.
The company supplies documentation such as COA, SDS (MSDS) and GC-MS reports with consignments, subject to the product and applicable documentation requirements.
For certification claims, buyers should refer to the relevant current certificates and their issuing bodies for the exact scope and validity of each certification.
We don’t ask you to trust us. We ask you to test us.
Website: https://kanhanatureoils.com
Email: info@aromatherapyoil.in
Phone: +91 98108 05866
Unit-1: Adjoining HUDA Plot No. 682, M.I.E. Part-1, Bahadurgarh, Haryana – 124507
Unit-2: 677, M.I.E., Part-1, Bahadurgarh, Haryana – 124507